About Stats Perform










Stats Perform helps the world experience sport with greater speed, depth, and understanding. By combining trusted Opta data with advanced AI, we power the content, video, insights, and technology that bring fans closer to every moment and help our customers grow.







Across media, broadcast, betting, teams, leagues, and technology, we help organisations create sports experiences that move faster, feel smarter, and bring every fan closer to the moments that matter.
0.0
Petabytes of proprietary sports data

0
Global competitions covered
0k+
Matches covered annually
Top 0
Betting sportsbooks
0th
Out of the Top 10 largest global tech companies
0th
Out of the Top 5 most viewed sports broadcast networks
0th
Out of the Top 10 global football teams


Join a global team shaping the future of sport with opportunities to grow, collaborate, and make an impact.
See Current Jobs
1M+ monthly active users visit Opta Analyst
Opta Analyst is Stats Perform's award-winning sports analysis platform, where Opta's live and historical data is turned into entertaining, highly engaging stories by a team of specialist editors, analysts and data storytellers.
The insights and behavioural data we capture from global sports fans interacting with Opta Analyst helps us refine and optimise our product offering for the world’s largest leagues, broadcasters, publishers, sportsbooks and brands.
Visit the Opta Analyst











Opta: 30 Years of Data Innovation in Football
% English Players
The percentage of English players has dropped by half over the last 30 years and 63% of managers were English in 1996-97 compared to 11% in 2024-25. Imports.
Shooting Accuracy
As technical quality has increased, most metrics have improved and players are now more likely to hit the target than they were 30 years ago. Accurate.
Conversion Rate
A 1% difference may not sound a lot but it means roughly that Premier League teams average eight shots per goal instead of nine these days. Clinical.
Away Wins
Home advantage is still a key but the strength of the big teams has meant a draw is seen as two points dropped rather than a point gained. Gain.
0-0 Draws
The last two full seasons have seen the highest goals per game rates in Premier League history, so 0-0 draws have become less common. Stalemate.
% Goals from Set Pieces
Around one third of goals are scored from set plays, so teams have hired set piece coaches to gain competitive advantage. Margins.
% Goals Outside Box
The introduction of Expected Goals has seen long range shots decline in recent seasons by about two thirds, but teams are still scoring at the same rate. Patience.
% Overseas Players
The Premier League has become ever more cosmopolitan with 62 different nationalities represented in 2025-26 compared to 41 in 1996-97. Diversity.
% Headed Goals
Goals from headers had dipped to just 13% of total strikes as recently as five seasons ago, but they have made a comeback in 2025-26. Retro.
Points Needed to Win Title
Manchester United won the title with 75 points, the fewest of any champion in Premier League history, while no team in the 21st Century has won it with fewer than 80. Summit.
% Goals from Corners
Goals from corners have become a far more regular occurrence in recent seasons. Routines.
Penalty Conversion
Opta data on penalty takers is used by players and goalkeepers to predict what their opponent will do and has seen success rates increase. Informed.
Drawn Matches
Teams know that winning one and losing one game gets more points than two draws so there has been more risk and a reduction in draws. Ambition.
Pass Completion
Modern teams have a far more measured and controlled style of play which means keeping possession is the priority. Precision.
% Clean Sheets
The number of goals scored has increased in the last few seasons and as a result it has been harder to keep clean sheets. Bombardment.
Schedule time with Opta and Stats Perform
Speak to our experienced sales team.
Opta’s method of data collection has developed and evolved considerably over the years. In 1996 we were collecting 50-60 data points, post-match, with pen and paper using stop-start on VHS tapes.
Today, thousands of data points are precisely collected live and enriched with AI to be aggregated or manipulated to create tens of thousands of data points, all with the additional context of where all 22 players are on the pitch and how they affect play.

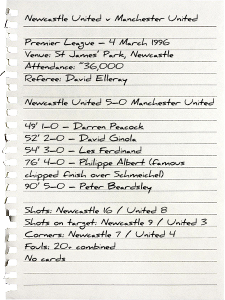

Unique data points per match
The level and depth of data we now collect has expanded significantly from a basic overview to one where nuanced performance both on and off-the-ball can be analysed depending on a client’s individual needs.
In 2026 we now collect over a million datapoints for each and every match using the latest computer vision techniques.
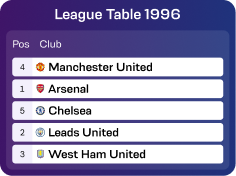


This comparison uses key data points that we captured and recorded from Opta's first Premier League season of 1996-97 to the latest campaign in the same competition 30 years later. Comparison.
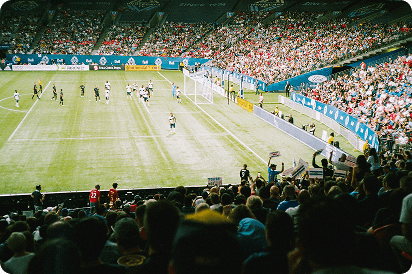



What does the data say about the evolution of football?
We asked OptaJoe himself to explain how the numbers behind football has changed and the reasons why.
| Stat Category | 1996-97 | 2025-26 | Opta Fact |
|---|---|---|---|
| % headed Goals | 19% | 18% | Goals from headers had dipped to just 13% of total strikes as recently as five seasons ago, but they have made a comeback in 2025-26. Retro. |
| % Goals outside box | 14% | 16% | The introduction of Expected Goals has seen long range shots decline in recent seasons by about two thirds, but teams are still scoring at the same rate. Patience. |
| % Goals from corners | 13% | 18% | Goals from corners have become a far more regular occurrence in recent seasons. Routines. |
| % Goals from Set pieces | 32% | 36% | Over one third of goals are now scored from set plays, with teams now hiring set piece coaches to gain competitive advantage. Margins. |
| Penalty conversion | 76% | 80% | Opta data on penalty takers is used by players and goalkeepers to predict what their opponent will do and has seen success rates increase. Informed. |
| 0-0 Draws | 11% | 7% | The last two full seasons have seen the highest goals per game rates in Premier League history, so 0-0 draws have become less common. Stalemate. |
| Drawn matches | 31% | 26% | Teams know that winning one and losing one game gets more points than two draws so there has been more risk and a reduction in draws. Ambition. |
| Away wins | 26% | 29% | Home advantage is still key but the strength of the big teams has meant that more points are now won on the road. Gain. |
|
Points needed to win title |
66% | 77%* | Manchester United won the title with 75 points in 1996-97, the fewest of any champion in Premier League history, while no team in the 21st Century has won it with fewer than 80. Summit. |
|
% Clean sheets |
30% | 26% | The number of goals scored has increased in the last few seasons and as a result it has been harder to keep clean sheets. Bombardment. |
|
% English players |
57% | 27% | The percentage of English players has dropped by half over the last 30 years and 63% of managers were English in 1996-97 compared to 11% in 2024-25. Imports. |
|
% Overseas players |
30% | 68% | The Premier League has become ever more cosmopolitan with 62 different nationalities represented in 2025-26 compared to 41 in 1996-97. Diversity. |
|
Shooting Accuracy |
45% | 48% | As technical quality has increased, most metrics have improved and players are now more likely to hit the target than they were 30 years ago. Accurate. |
|
Conversion rate |
11% | 12% | A 1% difference may not sound a lot but it means roughly that Premier League teams average eight shots per goal instead of nine these days. Clinical. |
|
Pass completion |
69% | 83% | Modern teams have a far more measured and controlled style of play which means keeping possession is the priority. Precision. |