ProVision
Unearth underlying player and team performance insights in seconds
Request a demo


Identify tactical insights to inform match preparation and longer-term player traits to support recruitment
Source deeper insights
Utilise hundreds of Opta data filters to identify tendencies in relation to playing styles, game state, period and more.

Build customised data reports
Build your own detailed data reports, powered by your own recruitment KPIs, which can be run after each matchday.

Create powerful visualisations
Present performance insights using a wide range of templates, including radars, charts and heat maps.

Integrate into your coding workflow
Connect to play-by-play events and your customised ProVision reports via your preferred coding platform.

Analyse team & player performance through the prism of your game model
Build your own metrics
Create your own stats derived from multiple Opta events, qualifiers and AI-enriched metrics, aligned to role-specific KPIs.

Benchmark your squad
Use your own metrics to benchmark the performance of your first team squad match-by-match for comparison against recruitment prospects.
Analyse performance in context
Combine player tracking data with relevant game level filters, including the game state and match clock, to get a better understanding of the context behind performance.
Agile functionality to fit your workflows
Powered by Opta Vision
Interrogate Opta Vision’s suite of AI enriched metrics to get a deeper understanding of individual and collective performance.
Metrics include:
-
Shape Analysis
-
Phases of Play
-
Off-Ball Runs
-
Pressure Intensity
-
Line-Breaking Passes
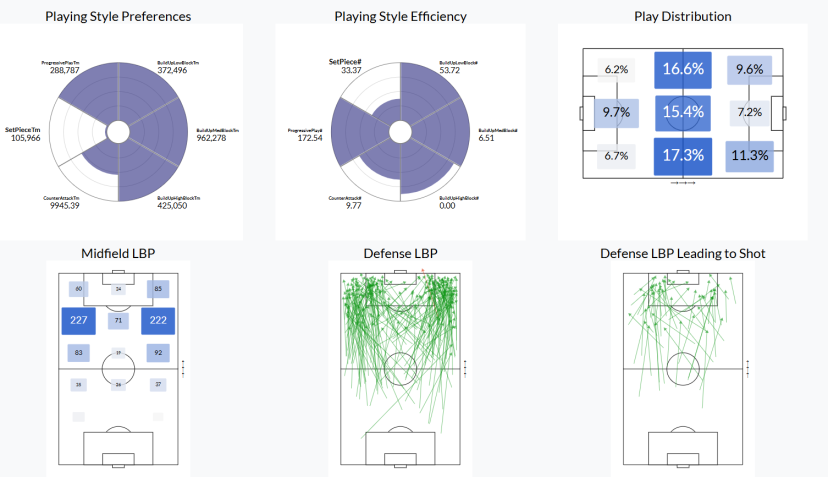
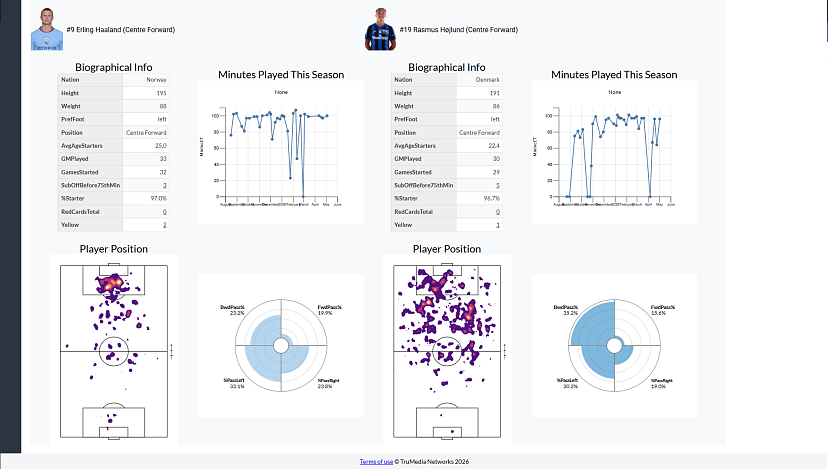
Build Visually Engaging Data Dashboards
Create your own dashboards, displaying customised Opta data visualisations to enhance the way your analysis is presented to technical staff and key decision makers.
Request a demoAPI Connectivity & Integrations
ProVision’s API enables you to pull a full season of data in less than a minute, with automated updates directly into coding platforms, such as R and Python, as well as into visualisation tools including Tableau.
Speak to an expert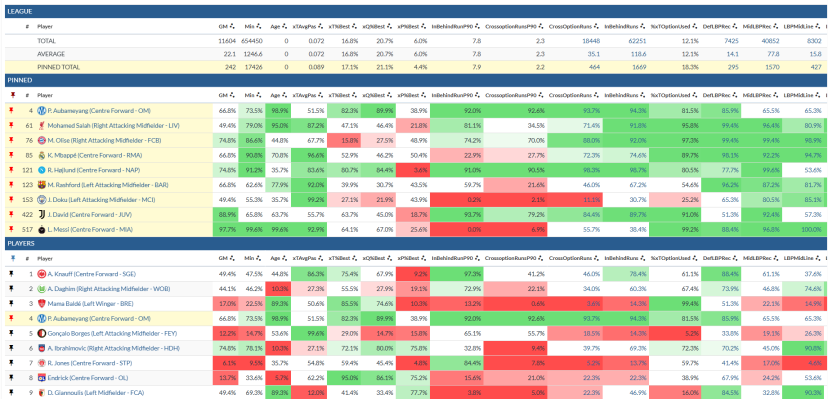
How ProVision is empowering our clients

In the analysis we carry out for the technical staff and first team, ProVision is helping us to contextualise the technical-tactical events of our team and of the rivals we play against.
 Alvaro Arranz, Head of Data Analysis and New Sporting Technologies, Real Betis
Opta Vision-powered data analysis impact
See how Opta Vision-powered data analysis can have a positive impact to your wider analysis and recruitment workflows
Get in touch