Opta Vision
Powering advanced
football analysis: at scale
Opta Vision combines tracking and event data to power Opta’s richest football dataset.
Available across over 80 of the world’s leading competitions, Opta Vision’s AI-enriched predictive models enable analysts to identify new and actionable insights into underlying performance, whilst empowering storytellers to drill deeper into the game’s key moments to tell more impactful stories.
Talk to an expert




Why do teams, tactics writers and producers turn to Opta Vision?
Opta Vision captures dynamic XY field locations for all 22 players in the match, uninterrupted, from the kick-off to the final whistle – totalling over 2 million individual data points per game.
This empowers users to:
- Utilise raw Opta Vision tracking data, via feeds, to analyse every player’s high-intensity output, off-ball run and pressure application in a game, all synchronised to Opta event data.
- Enhance pre-match and post-match team analysis by highlighting changes to each team’s shape, in and out of possession, at key moments.
- Better quantify the on-ball decision-making of players, based on the type of passes they choose, and choose not, to make.
How Opta Vision data is captured
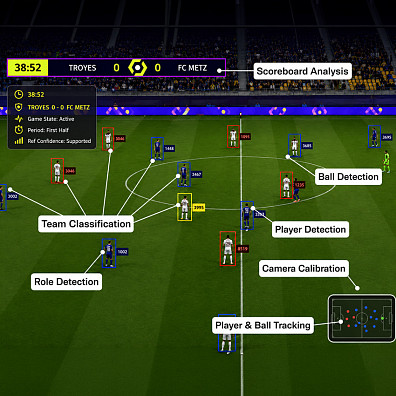
Event & Tracking Data Collection
Consistent, accurate, event data is collected by skilled Opta analysts. Tracking data from match footage is collected using remote feeds.
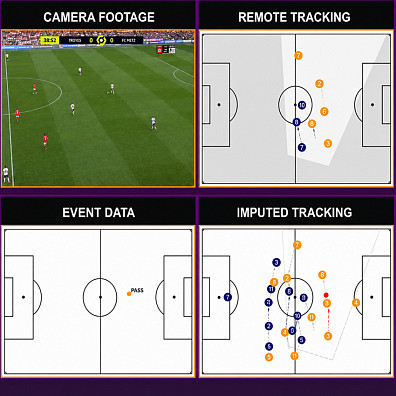
Generative AI
A pioneering diffusion model produces continuous tracking data for all players out-of-shot, resulting in complete tracking data for the match.
Data Synchronisation
We synchronise both event and tracking datasets in parallel with human-led QA.

AI Modelling
AI is applied to enrich data and generate new data points and multiple predictive metrics.
Data Available Through Opta Vision
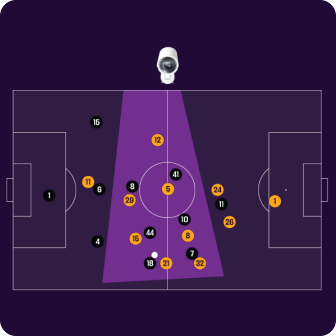
Raw Tracking Data
Uninterrupted player trajectory data for every player on the pitch, fully synchronised to on-ball events, for dozens of competitions worldwide.
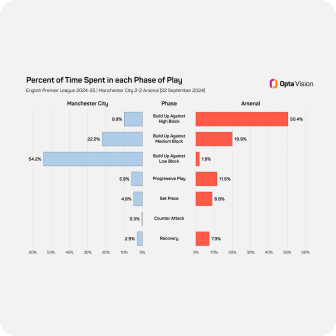
Phases of Play
Phases of Play breaks down each possession in a game into distinctive rules-based phases, allowing you to compare the different approaches of teams with and without the ball.
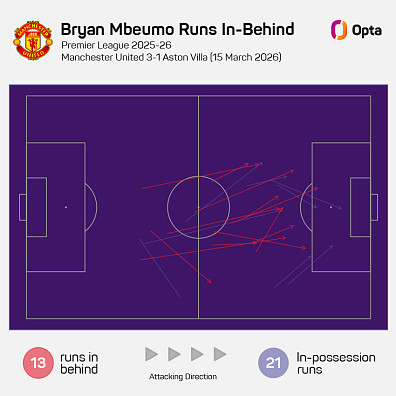
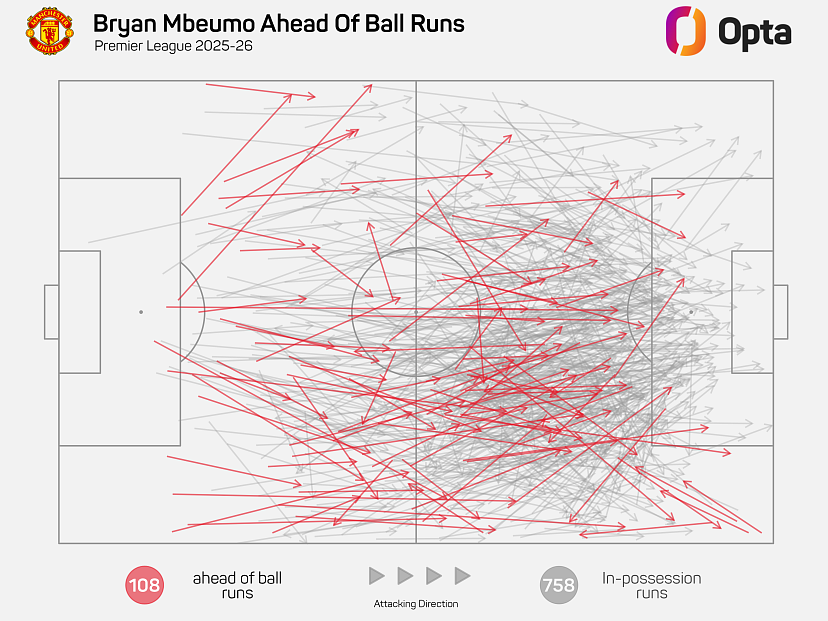
Off-Ball Runs
Opta Vision automatically detects and categorises each player’s attacking and defensive off-ball runs, unlocking new opportunities to analyse a player’s performance in the game.
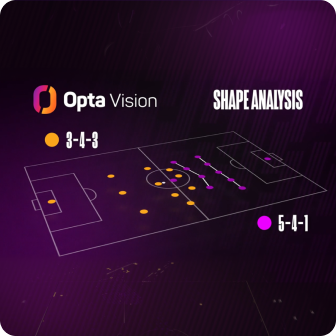
Shape Analysis
Look beyond traditional formations in your analysis by identifying each team’s true shape, in and out possession, at different points of a game.
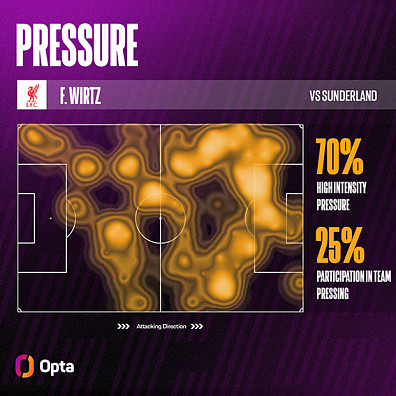
Pressure Intensity
Pressure Intensity identifies when defensive players approach the player in possession with the aim of winning the ball or limiting pass options.
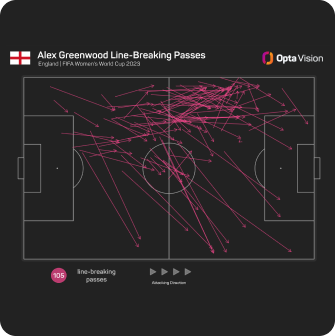
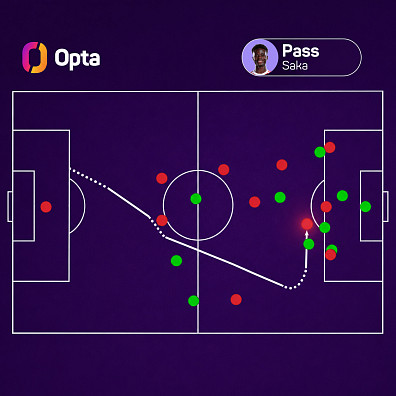
Line Breaking Passes
Using player location data, Opta Vision accurately captures all situations where a player’s pass successfully breaks an opposition line.
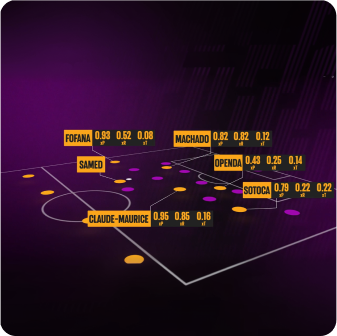
Pass Predictions
Opta Vision’s Pass Predictions comprise multiple metrics which help quantify a player’s passing ability and the wider impact of their passes.
Aggregated Fitness Data
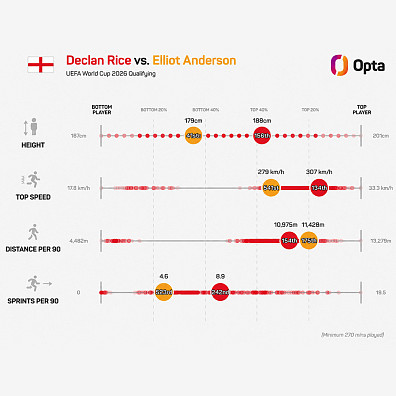
Fitness data, captured at 25 frames per second and broken down by FIFA’s performance thresholds, provide new insights into the high-intensity performance of every player.
The Opta Vision Difference
Depth
Opta Vision’s complete and fully synchronised tracking and event dataset creates unique metrics, aligned across your team’s data, from the same source.
Scalable
Opta Vision’s scalable, computer vision-led collection process means that you can access detailed data from every game for dozens of competitions.
Video
Opta Vision captures data from video, rather than freeze frame technology, to ensure our outputs for every action are informed by the physical movement of all players.
Quality
Our QA process keeps a human-in-the-loop at all stages of data collection, to guarantee accuracy and high-quality insights.
Dynamically Capturing Changes to a Team’s Shape
Shape Analysis is entirely data driven, powered by AI models which keeps track of all player movement.
This means that as well as identifying the initial team shapes, in and out of possession, Shape Analysis can also automatically detect each time a team’s shape changes as a game unfolds.
- Highlight to your audience the most common shapes used by a team during the season.
- Show the total time each player spends in different on-field positions within a shape, such as inverted full-backs moving into central midfield.
- Provide greater context to shape changes made by a coach as a result of a player injury, suspension or other absence.

Providing a Better Understanding of a Player’s Passing Tendencies
Pass metrics, such as ‘passes completed’ and ‘pass completion %’, lack crucial context to properly analyse how a player uses the ball.
Opta Vision’s Pass Prediction metrics provide a much clearer picture of a player’s passing tendencies, offering powerful new insights into their decision-making based on who, and who they choose not, to pass to.
- Identify the players who complete the most threatening passes, increasing their team’s chances of scoring.
- Showcase the players in a league who attempt the most difficult passes all over the pitch.
- Explain which players make themselves available to receive the ball from a teammate more than anyone else.
Evaluating Performance in High Pressure Situations
Pressure Intensity evaluates the pressure generated by the defending team against the player possessing the ball. Opta Vision dynamically assigns a pressure level to the three closest defending players to the player in possession and determines a value that quantifies the pressure applied.
Pressure Intensity provides both team analysts and studio pundits with insights into:
- The volume of pressure applied by defending teams and how their approach to closing down compares to other teams across a competition.
- Measure the efficiency of a team’s pressure, by directly linking their pressure intensity to the total times they win the ball back as a result of high pressure.
- The success rate of passes by an attacking player, based on the level of pressure they faced from opponents.

Learn more about Opta Vision from our experts
Our recent webinar, 20 New Ways Media (and Fans) Are Talking About Football, saw our team of Opta experts provide explain how Opta Vision is being successfully utilised by storytellers to grow and retain audiences, increase dwell time and differentiate their coverage.
Find out more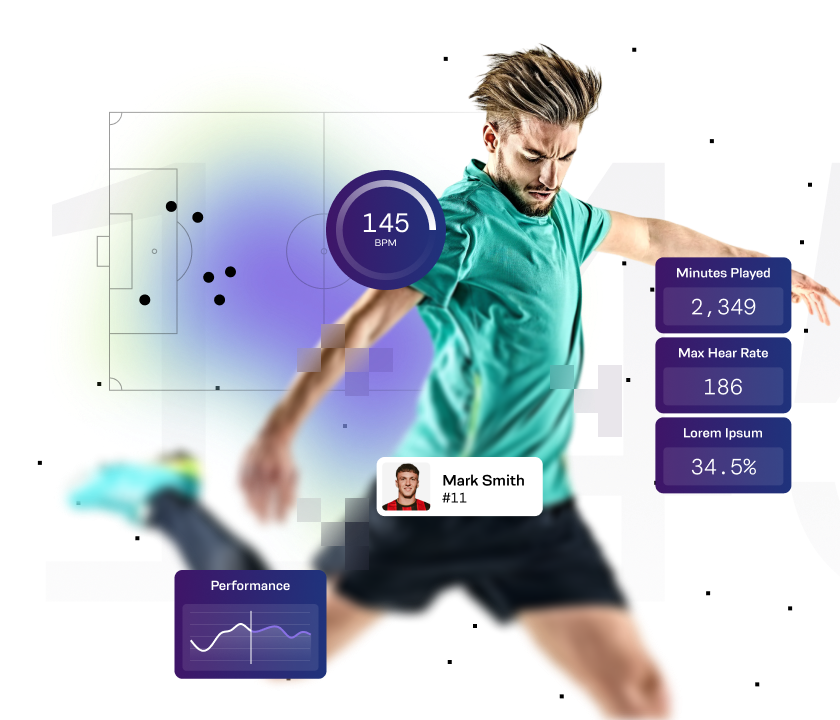
Are you ready to take your analysis to the next level?
Get in touch today to speak to us about how we can incorporate Opta Vision into your analysis workflows and enhance pre-match preparation and post-match evaluation.
Get in touch